Spainability rankings · Updated July 2026
Spanish towns with the lowest river-flood risk
A home-buy due-diligence sort: modelled river-flood depth at the town centre for T=10 / T=100 / T=500 — not vibes, not official cadastral maps.
The ranking
-
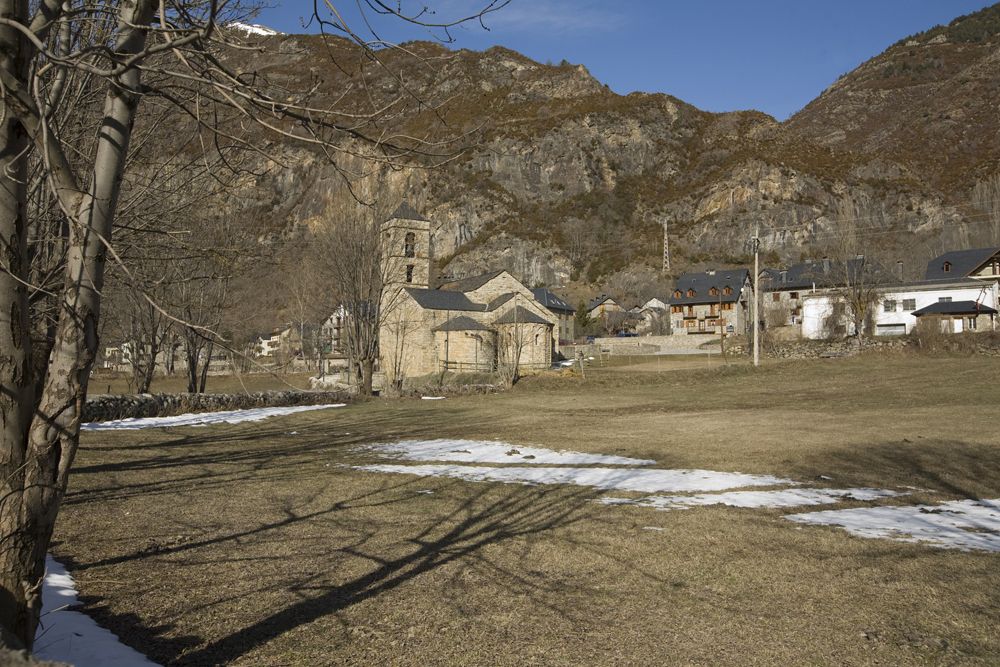
In Lleida.
-
In Lleida.
-
In Lleida.
-
In Lleida.
-
In Lleida.
-
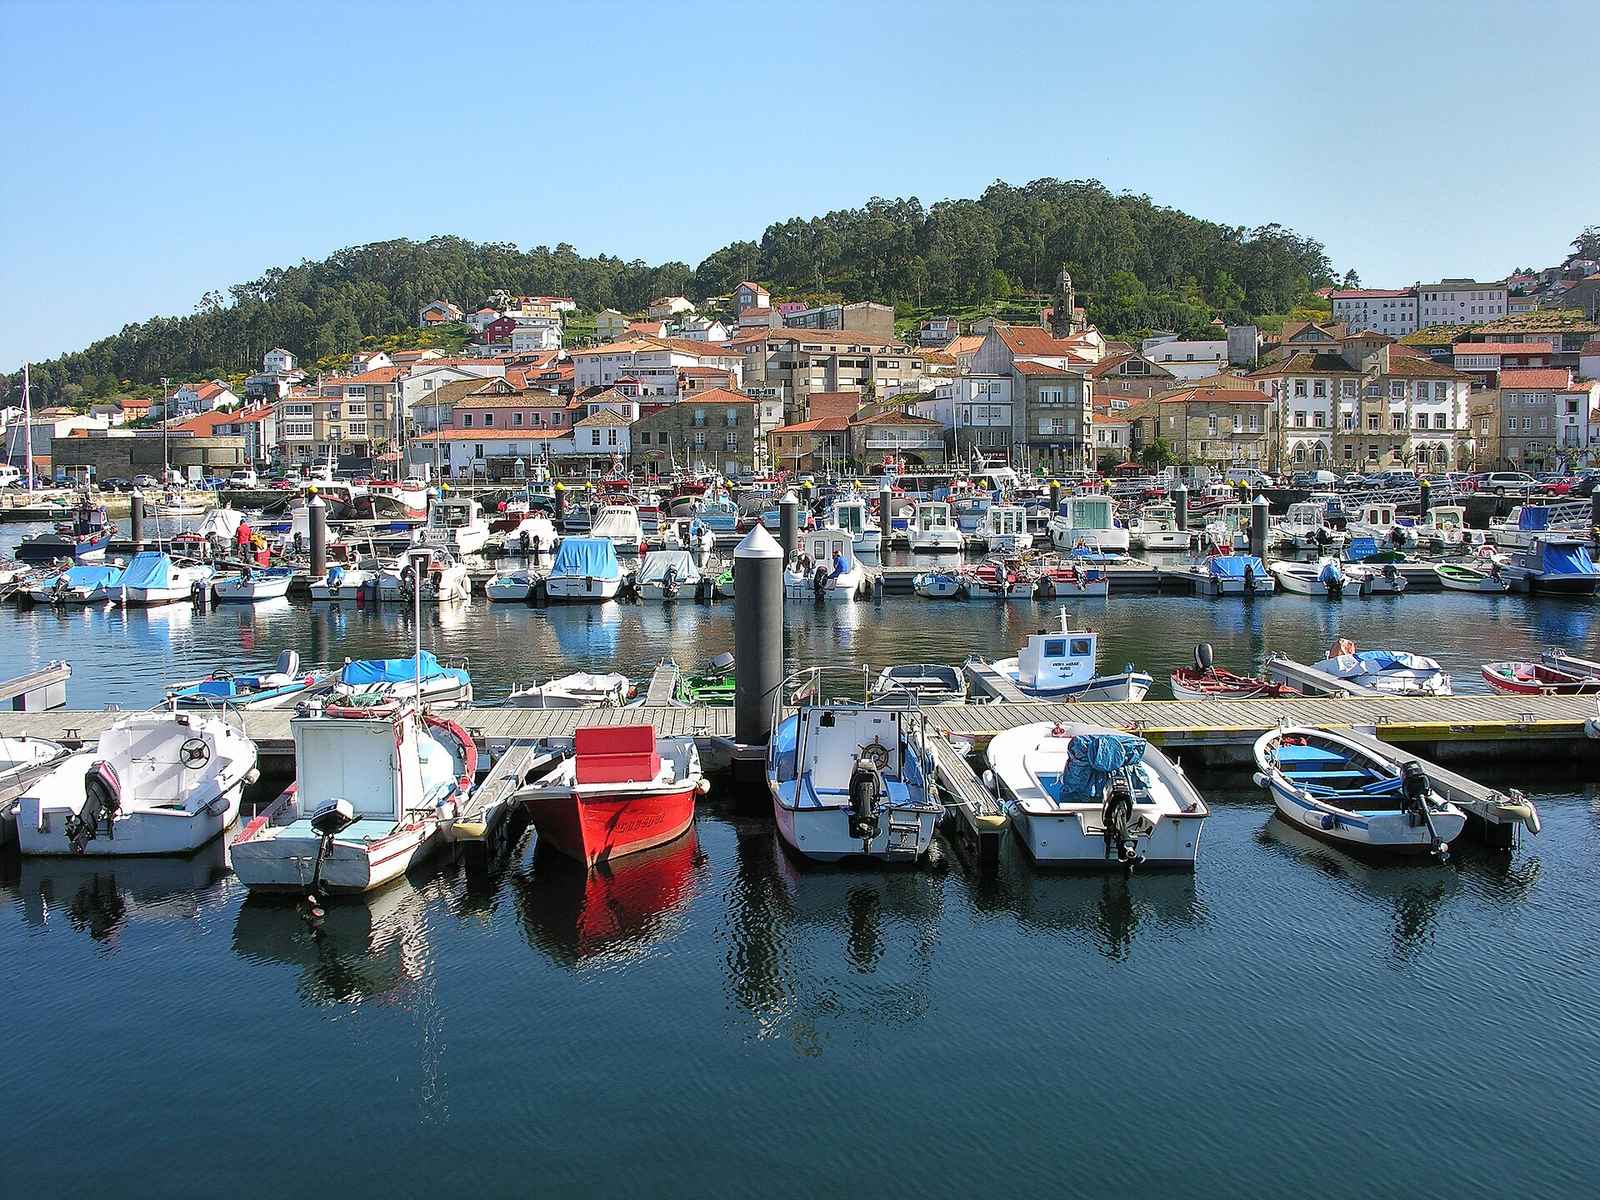
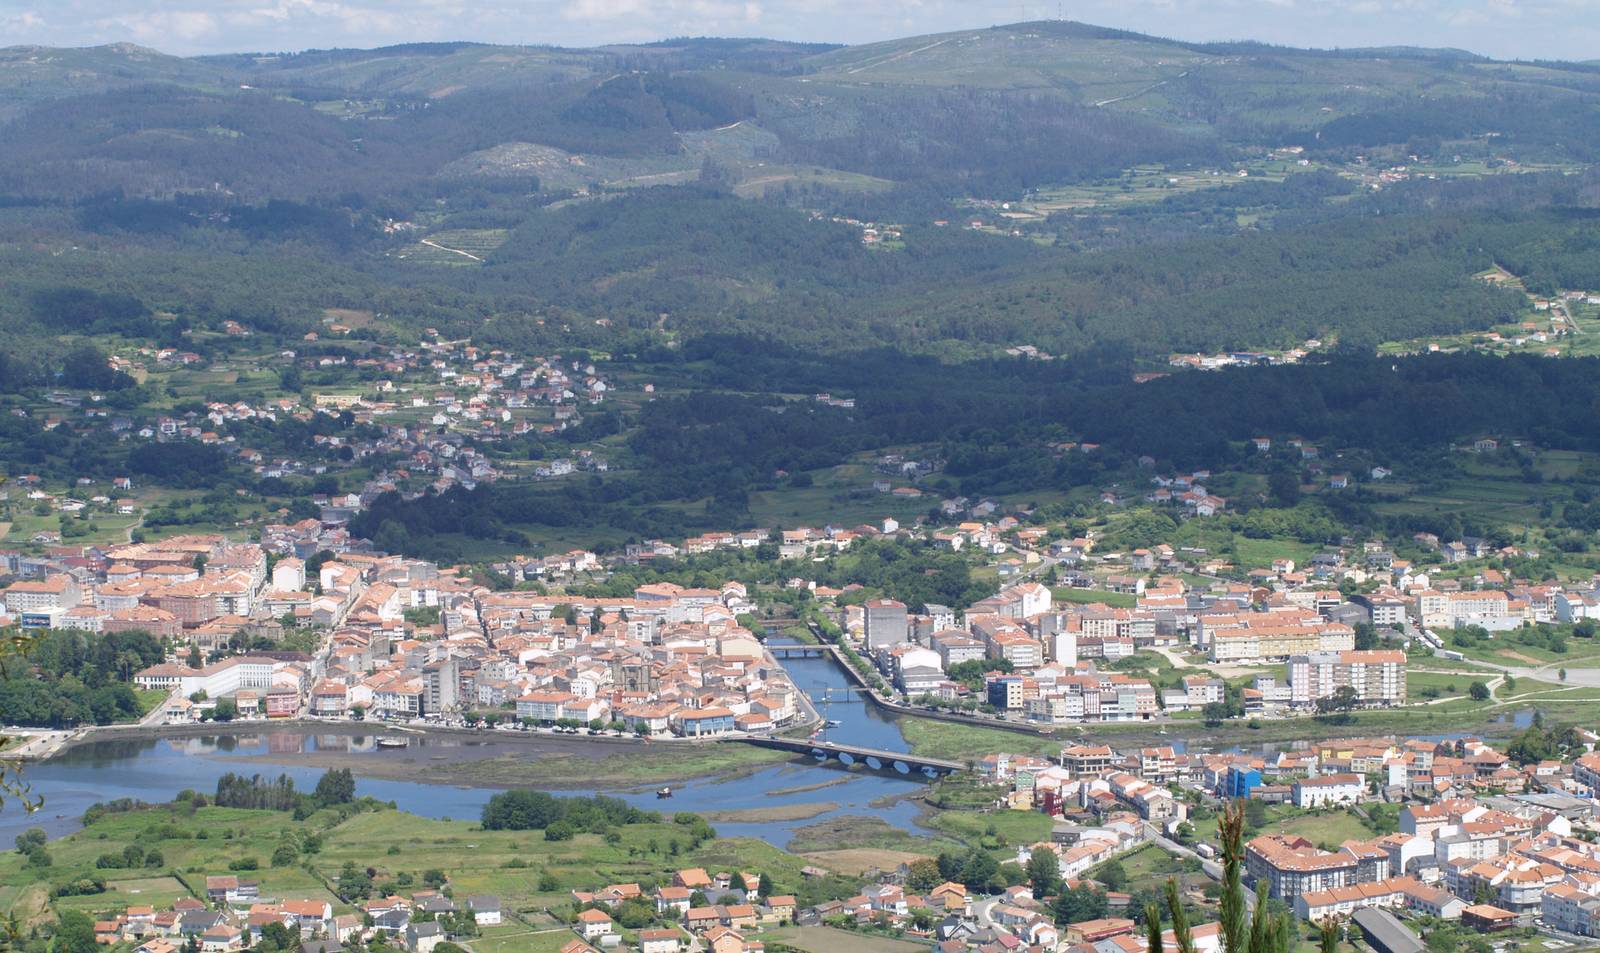
In A Coruña.
-
In A Coruña.
-
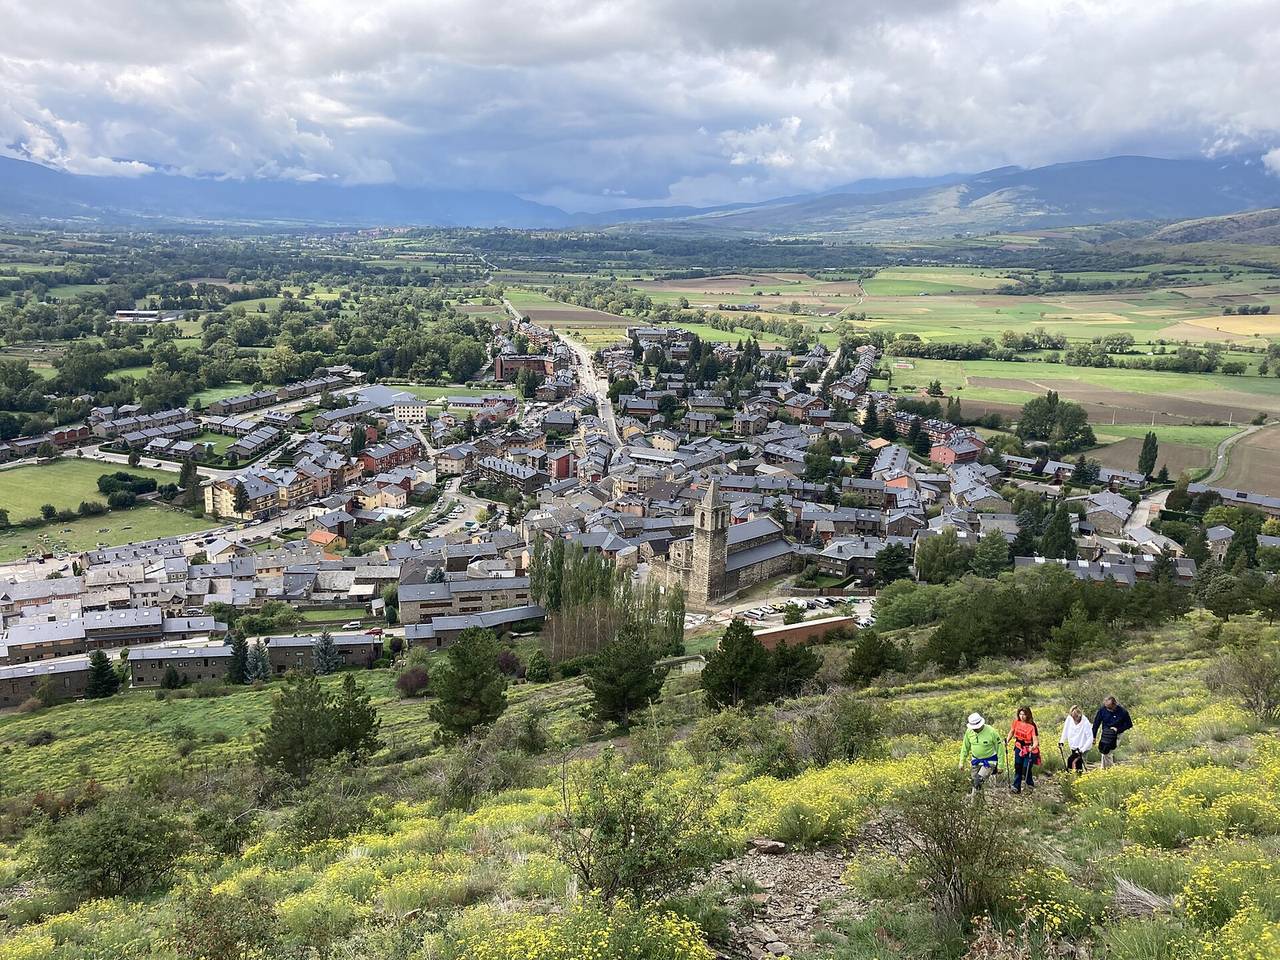
In Girona.
How we ranked this
We sorted every town with a Spainability page by flood risk score, breaking ties on summer high — a straight data sort, not a persona-weighted score.
- Data Town-level climate fields in our published metrics table (JRC CEMS-EFAS river flood, EGIF wildfire history, AEMET fire weather) — sources and caveats on every town page.
- Reproducible This is a straight column sort — re-run the same metrics and you get this exact order.
- What we don't score This is a modelled research product (JRC CEMS-EFAS), sampled at the IGN municipal centroid — not Spain's official SNCZI cadastral flood maps. A large municipality can flood elsewhere while the centre is dry (and vice versa). Coastal storm-surge and flash-flood micro-basins are out of scope.
Compare the top 8
| # | Town | Flood risk score | T=100 depth (centre) | Summer high | Home price |
|---|---|---|---|---|---|
| 1 | Llavorsí | 0 | 0 m | 20.4°C | no data |
| 2 | Pobla de Segur, La | 0 | 0 m | 20.4°C | no data |
| 3 | Rialp | 0 | 0 m | 20.4°C | no data |
| 4 | Sort | 0 | 0 m | 20.4°C | no data |
| 5 | Vall de Boí, La | 0 | 0 m | 20.4°C | no data |
| 6 | Muros | 0 | 0 m | 20.4°C | no data |
| 7 | Noia | 0 | 0 m | 20.4°C | no data |
| 8 | Llívia | 0 | 0 m | 21.4°C | no data |
Values from the Spainability dataset (INE / AEMET / regional sources). "no data" = we don't have that number for this town and never guess it.
Questions
Is this Spain's official flood map?
No. Official SNCZI lámina downloads are not scriptable (captcha-gated). We use open JRC CEMS-EFAS European river flood hazard rasters for the same Floods-Directive return periods, sampled at each town's centroid, and we label that honestly on every town page.
Why do so many towns score zero?
Most municipal centres sit outside the modelled T=100 flood extent. Among those zeros we break ties toward milder summers, then keep towns that have a full Spainability profile so you can dig into the rest of the data.
This ranks one climate metric, not your whole shortlist
Get your ranking, not this one →
This list scores one representative persona. Answer a dozen honest questions and we score all 8,132 municipalities against your priorities — climate, cost, healthcare, community, getting home — with the tradeoffs shown as plainly as the wins.
Take the 3-minute quiz →Last updated: July 2026 · Next update: on INE's next census release (expected 2027).
Re-generated from the Spainability dataset on each data release — the ranking is reproducible, not editorial.