Spainability rankings · Updated July 2026
Spanish towns with the lowest wildfire exposure (2010–2023)
Where forest fires actually burned least per square kilometre over the last decade-plus — from Spain's own EGIF fire records.
The ranking
-
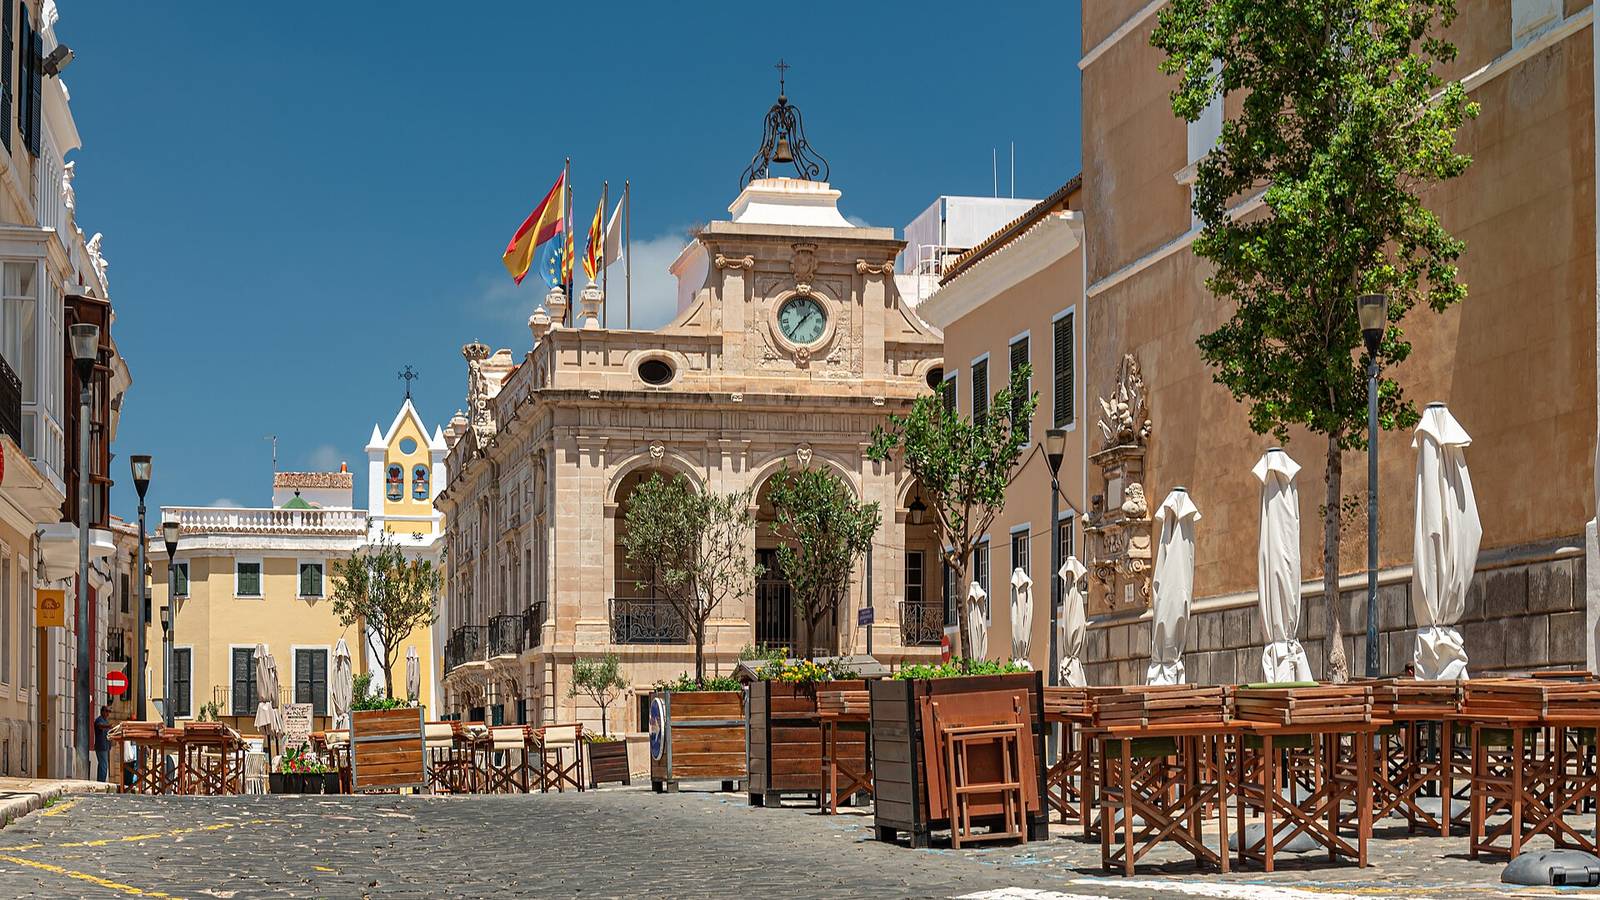
In Illes Balears.
-
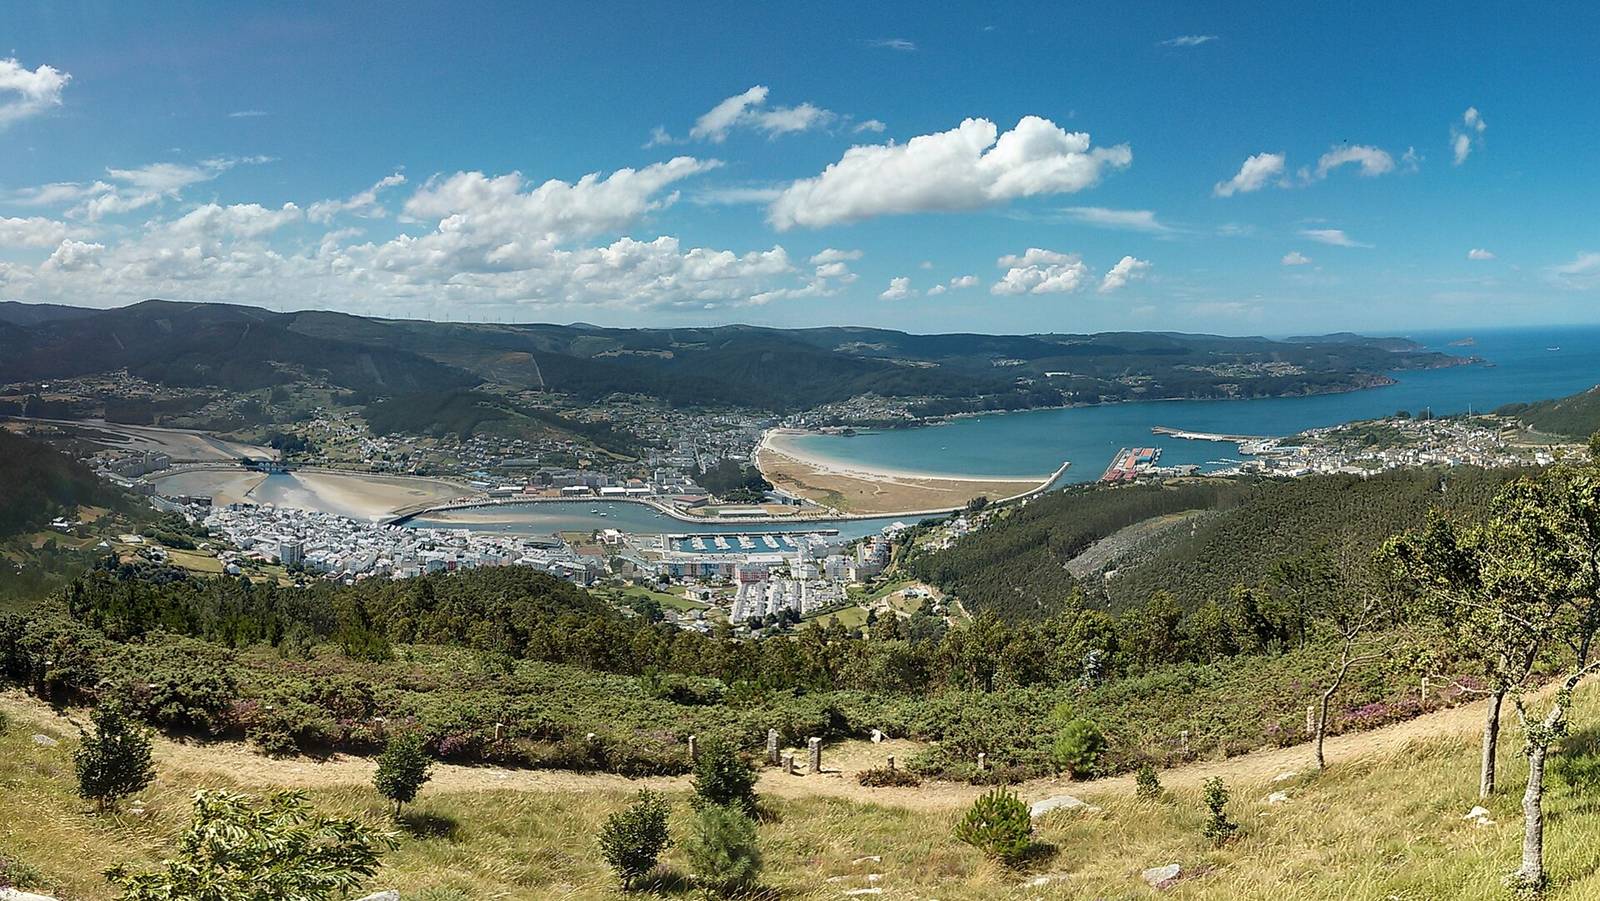
In Lugo.
-
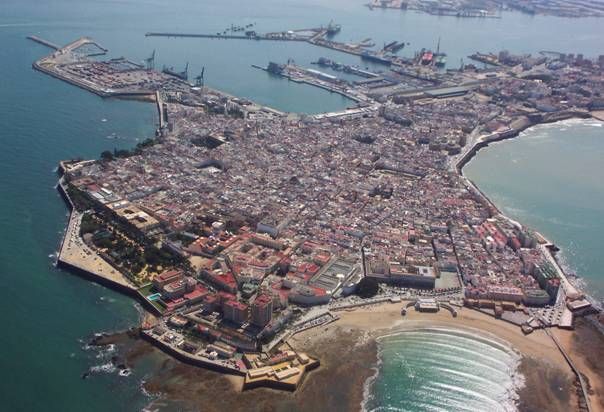
In Cádiz.
-
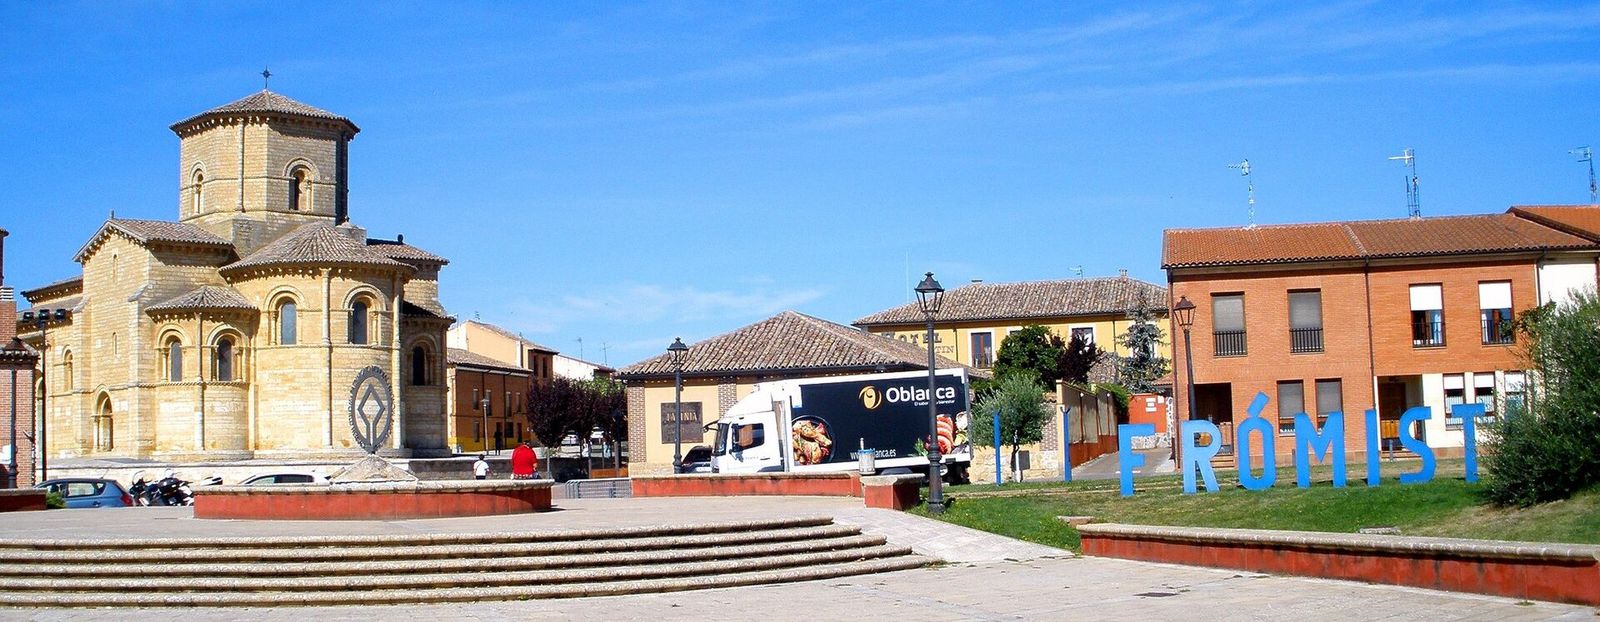
In Palencia.
-
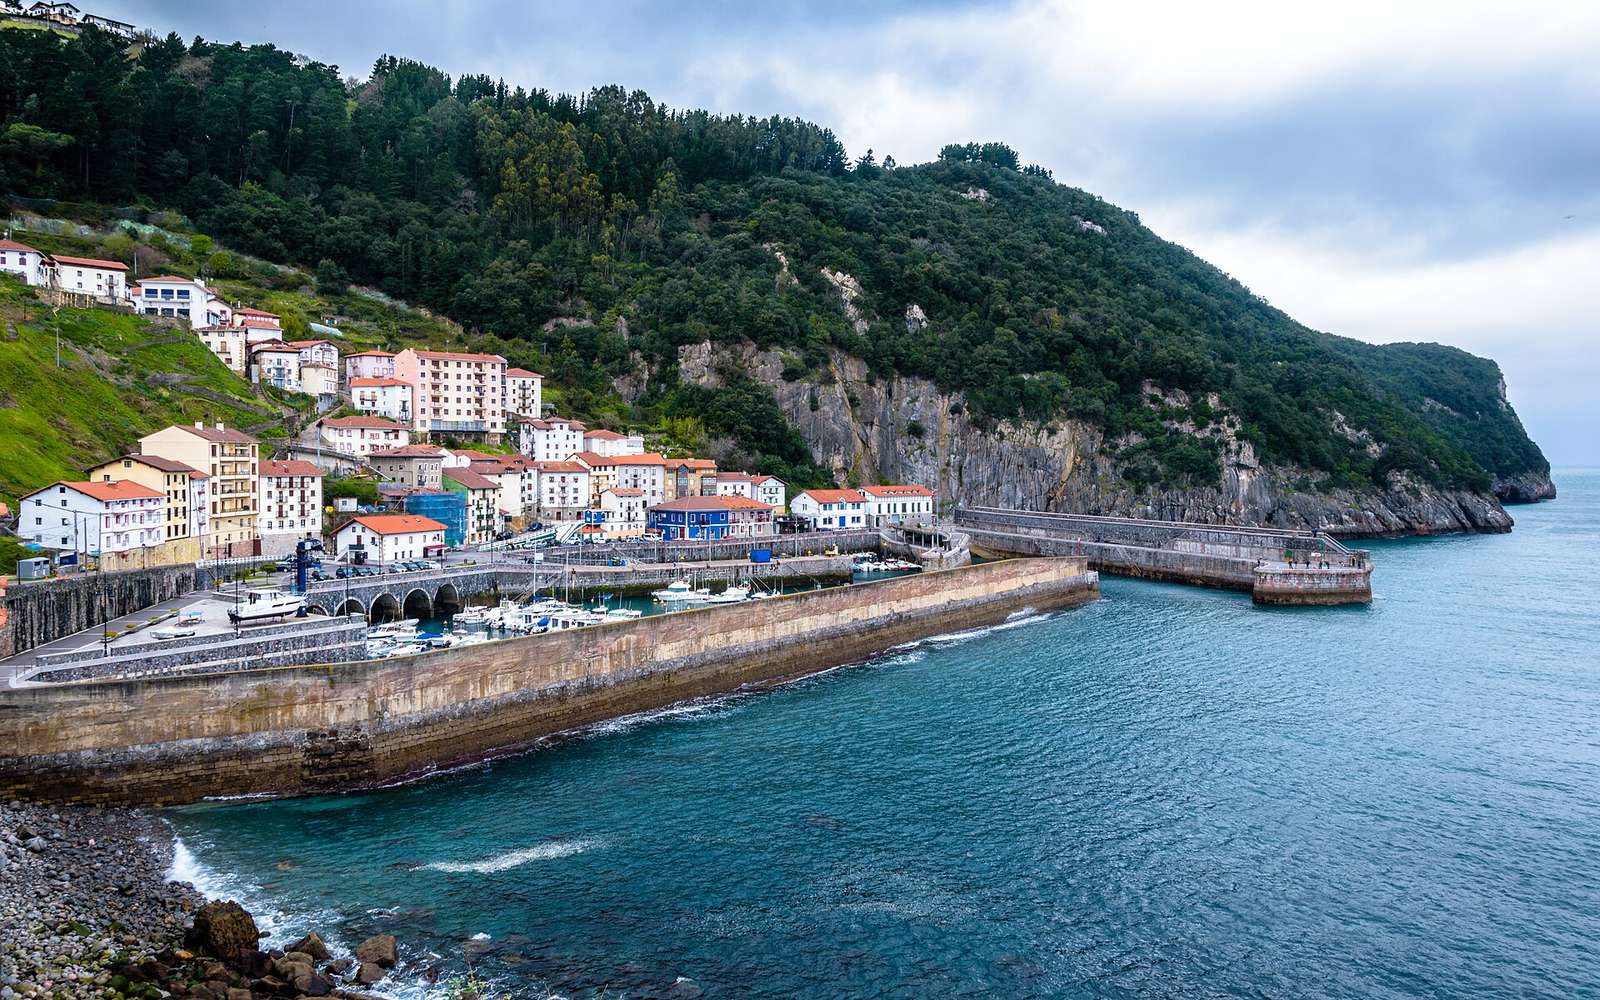
In Bizkaia.
-
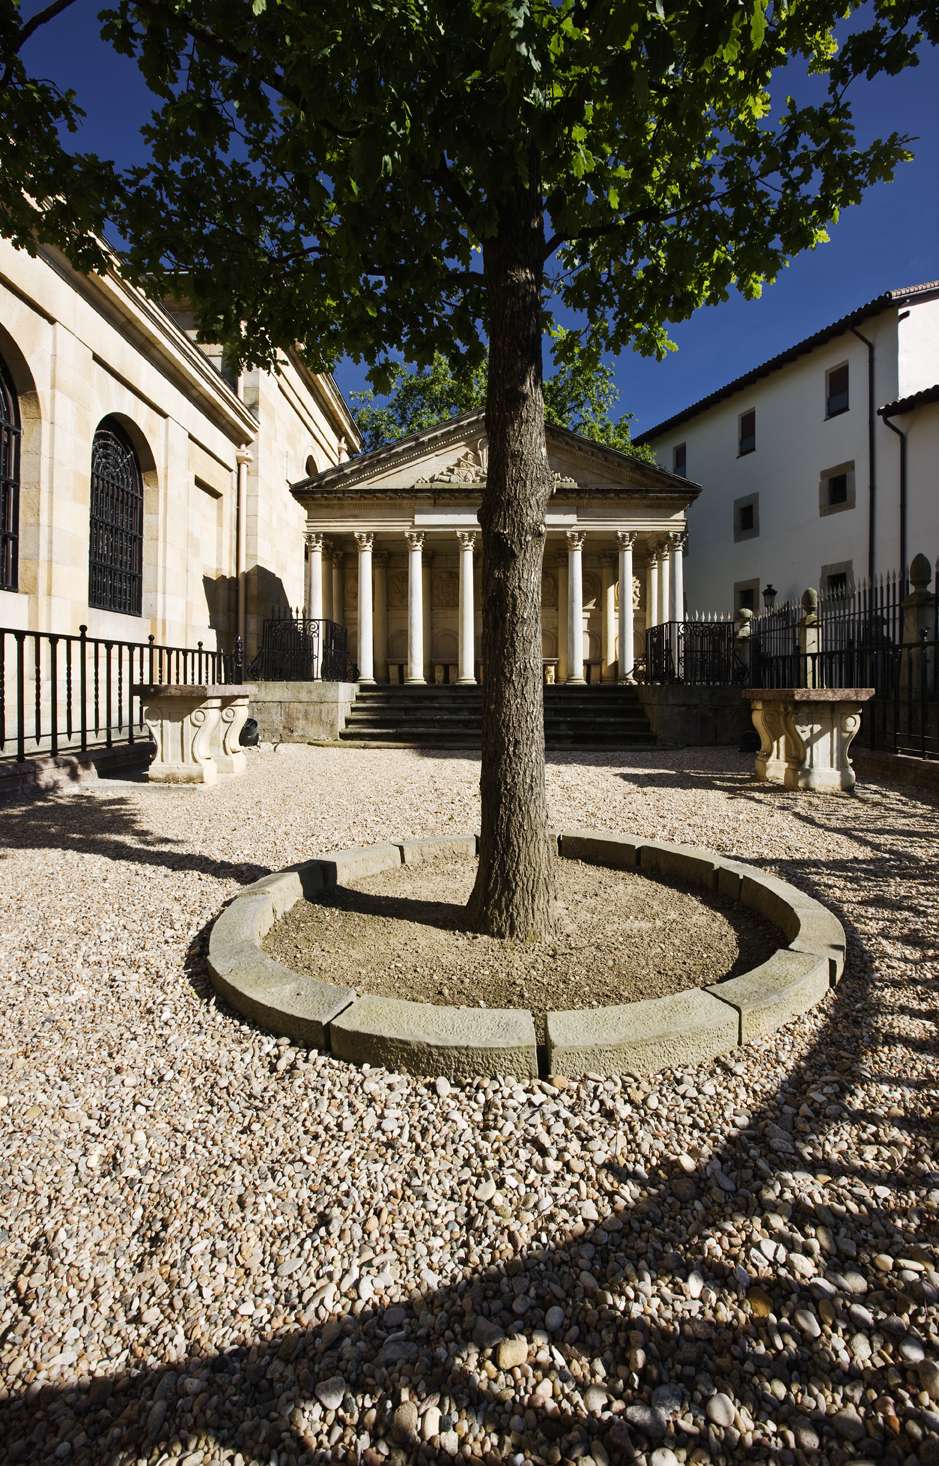
In Bizkaia.
-
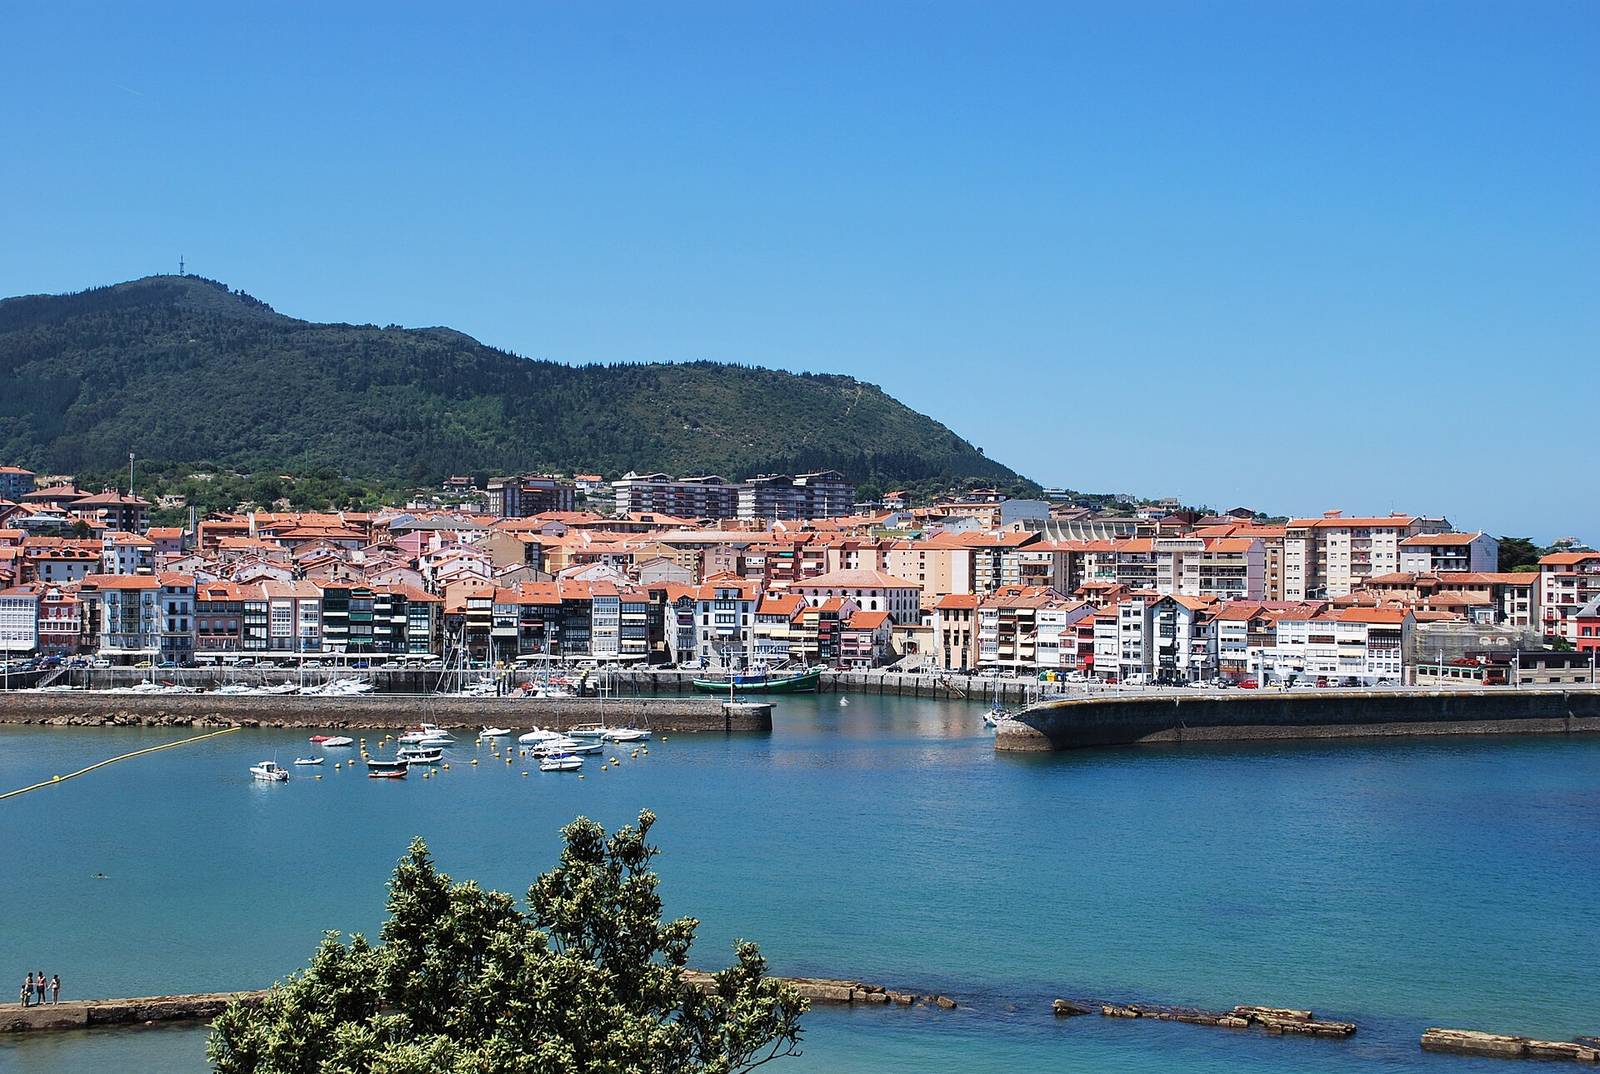
In Bizkaia.
-
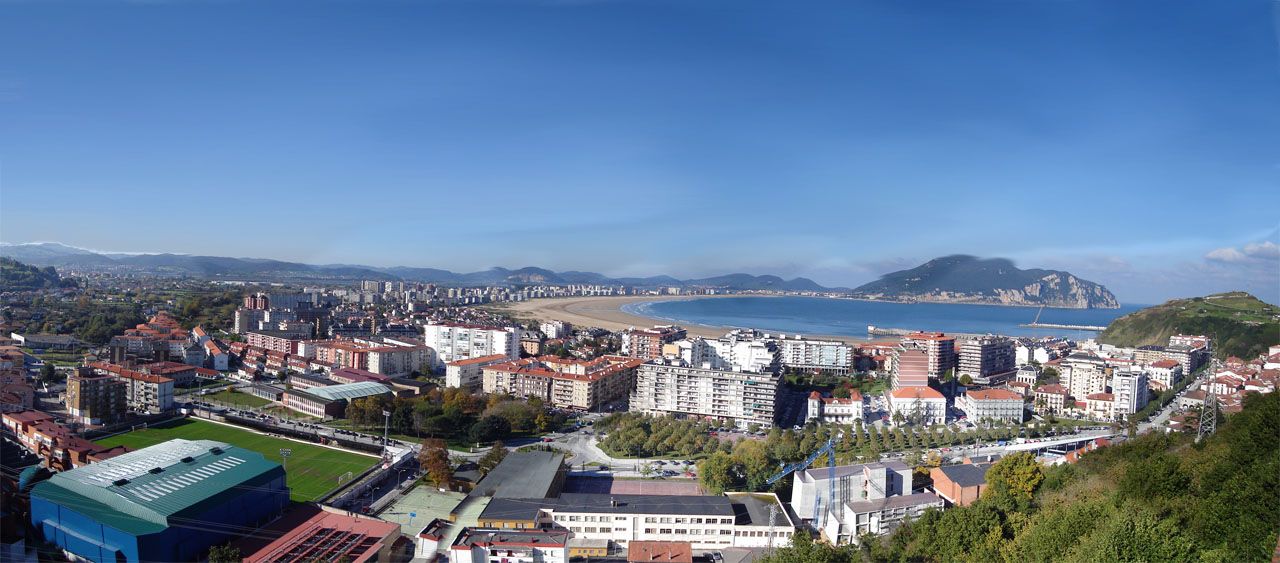
In Cantabria.
How we ranked this
We sorted every town with a Spainability page by burn rate 2010–23, breaking ties on high fire-weather days — a straight data sort, not a persona-weighted score.
- Data Town-level climate fields in our published metrics table (JRC CEMS-EFAS river flood, EGIF wildfire history, AEMET fire weather) — sources and caveats on every town page.
- Reproducible This is a straight column sort — re-run the same metrics and you get this exact order.
- What we don't score Past fires are not a forecast. We count EGIF forest fires attributed to each municipality (2010–2023) and normalise burned hectares by municipal area. Meteorological fire danger (AEMET FWI) is province-level and shown separately — it does not re-rank this list. Vegetation, slope and WUI micro-siting are out of scope.
Compare the top 8
| # | Town | Burn rate 2010–23 | Fires 2010–23 | High fire-weather days | Home price |
|---|---|---|---|---|---|
| 1 | Maó | 0 ha/km² | 0 | 13.8% | €2,812/m² |
| 2 | Viveiro | 0 ha/km² | 0 | 17.8% | no data |
| 3 | Cádiz | 0 ha/km² | 0 | 19.2% | €3,099/m² |
| 4 | Frómista | 0 ha/km² | 0 | 21% | no data |
| 5 | Elantxobe | 0 ha/km² | 0 | 21.7% | no data |
| 6 | Gernika-Lumo | 0 ha/km² | 0 | 21.7% | no data |
| 7 | Lekeitio | 0 ha/km² | 0 | 21.7% | no data |
| 8 | Laredo | 0 ha/km² | 0 | 21.8% | no data |
Values from the Spainability dataset (INE / AEMET / regional sources). "no data" = we don't have that number for this town and never guess it.
Questions
Does low past burning mean low future risk?
Not by itself. This ranking is historical exposure, not a hazard model. Pair it with the province fire-weather figure on each town page, and treat a zero-burn town in a high-FWI province as 'lucky so far', not 'safe forever'.
Why is Galicia both green and fire-prone in the news?
Galicia combines Atlantic moisture with large forest cover and a long EGIF fire history in some inland municipalities. Coastal cities often show low burn rates; Valdeorras-style inland belts do not. The list and town pages show that split in numbers.
This ranks one climate metric, not your whole shortlist
Get your ranking, not this one →
This list scores one representative persona. Answer a dozen honest questions and we score all 8,132 municipalities against your priorities — climate, cost, healthcare, community, getting home — with the tradeoffs shown as plainly as the wins.
Take the 3-minute quiz →Last updated: July 2026 · Next update: on INE's next census release (expected 2027).
Re-generated from the Spainability dataset on each data release — the ranking is reproducible, not editorial.